Description
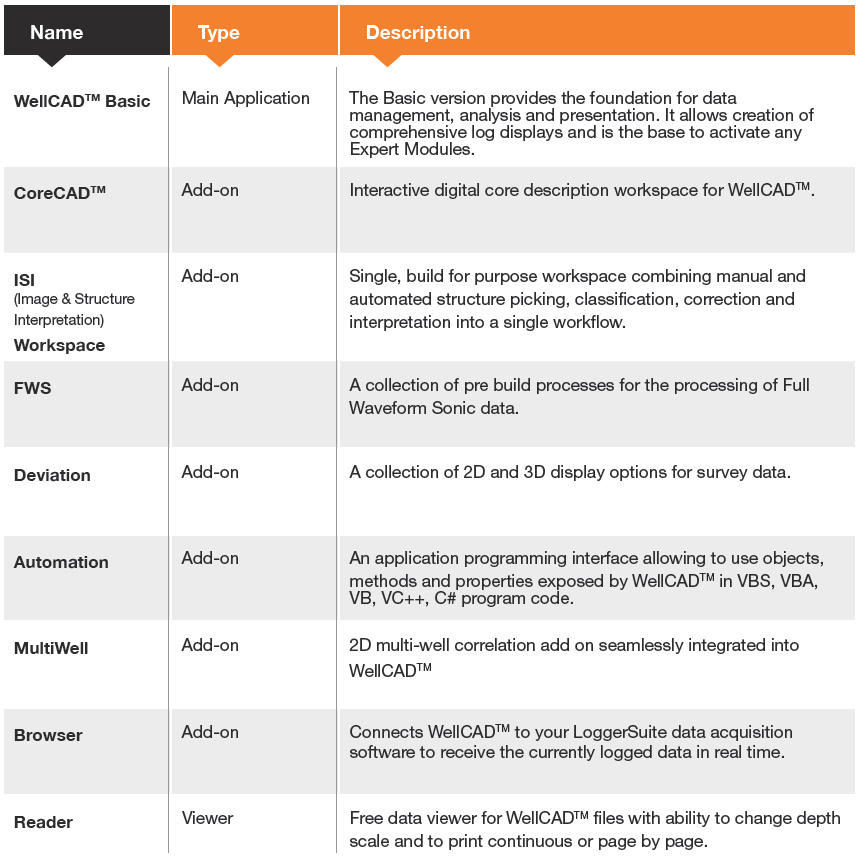
WellCAD© Basic Version 6.0 Well Log Processing Software
This is for a Node Locked license that is linked to one computer only and cannot be transferred between computers. It includes one year of Support & Maintenance. Future years of Support & Maintenance are 20% of the purchase price including modules. If customer would like a USB Dongle-based license, they will also need to purchase a USB key: https://mountsopris.com/store/Dongle.
One year Support & Maintenance included, renewable every year from date of purchase:
- Free Priority Support
- Free replacement of broken dongle
- Free Upgrades
Product Overview
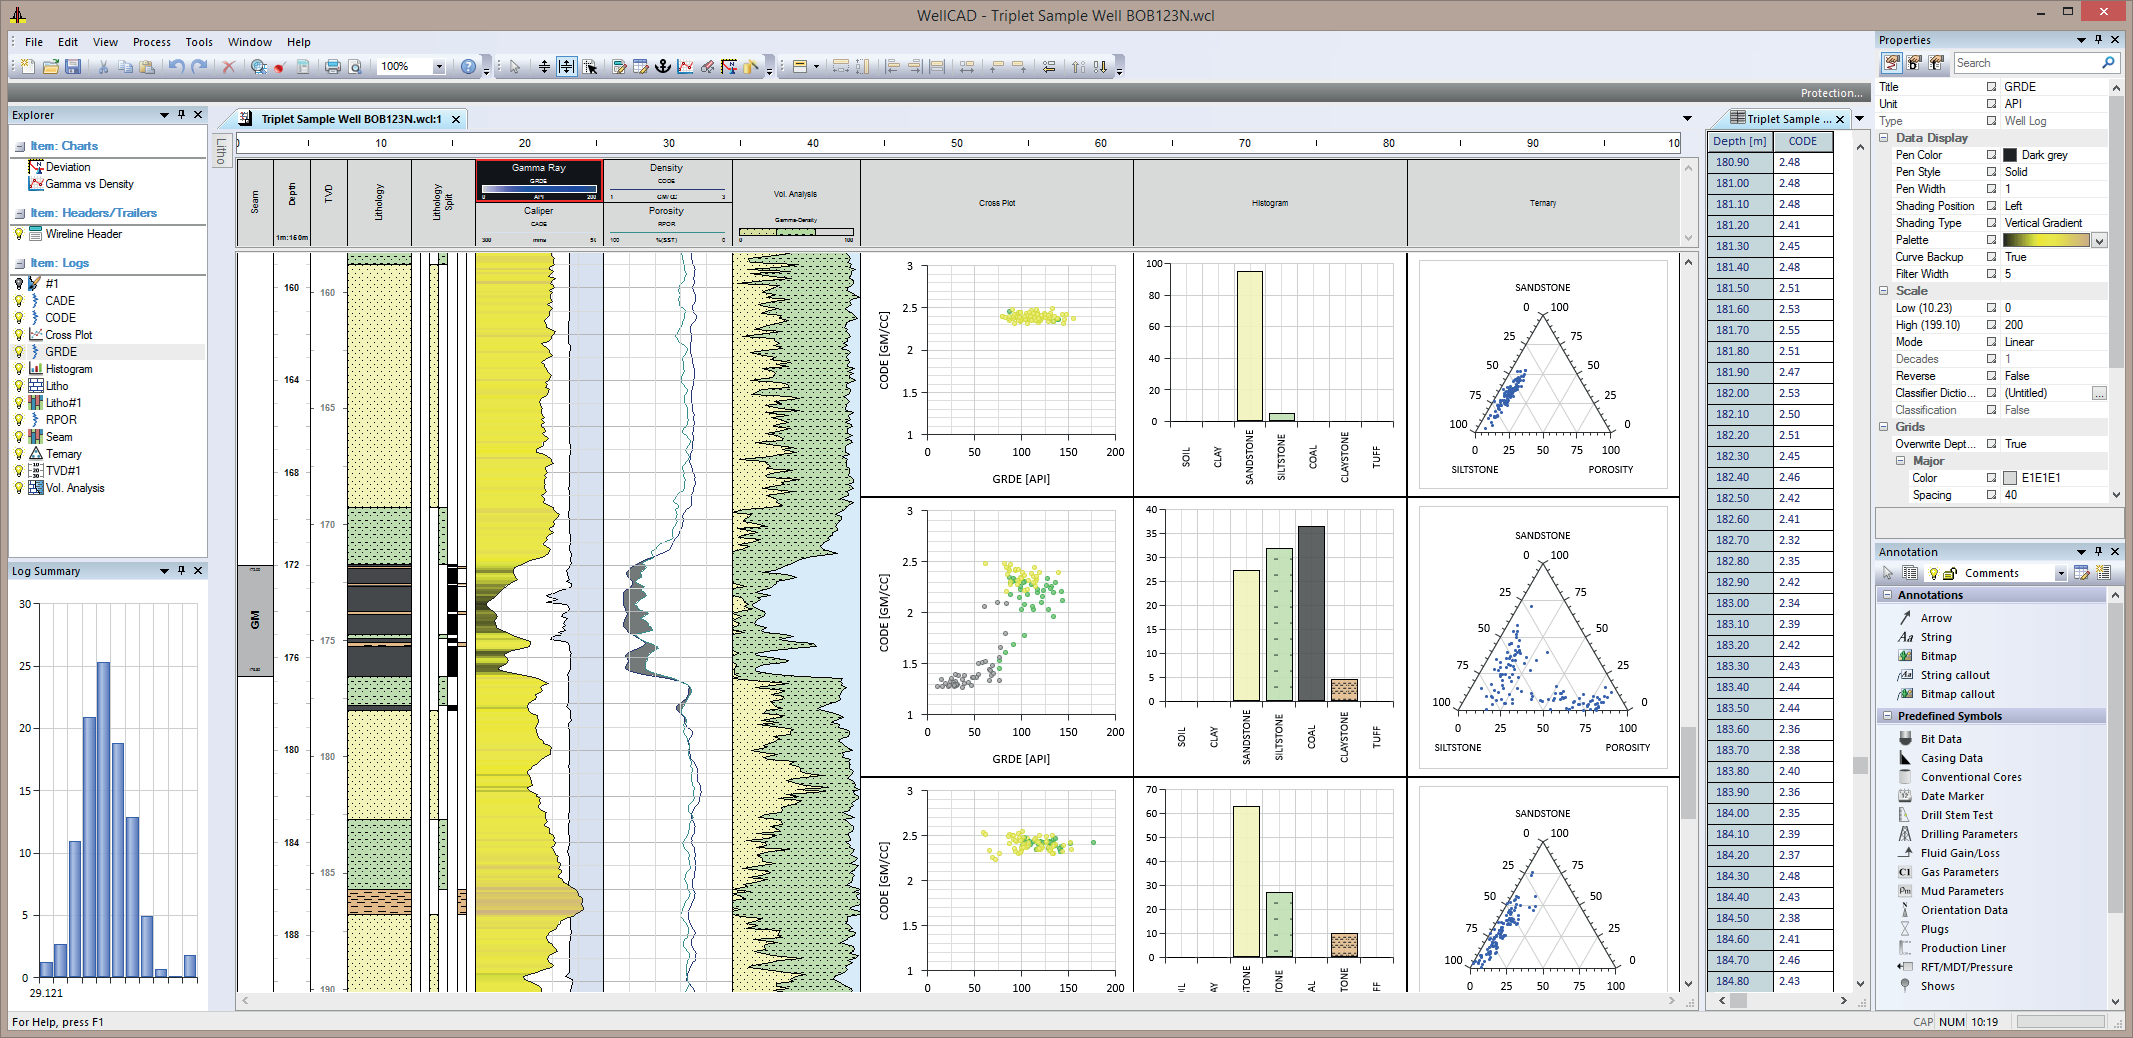
Rich Graphical Display
- Fully graphical driven standard Windows* software
- Real-time data display generated from the depth / time based information held in the data repository
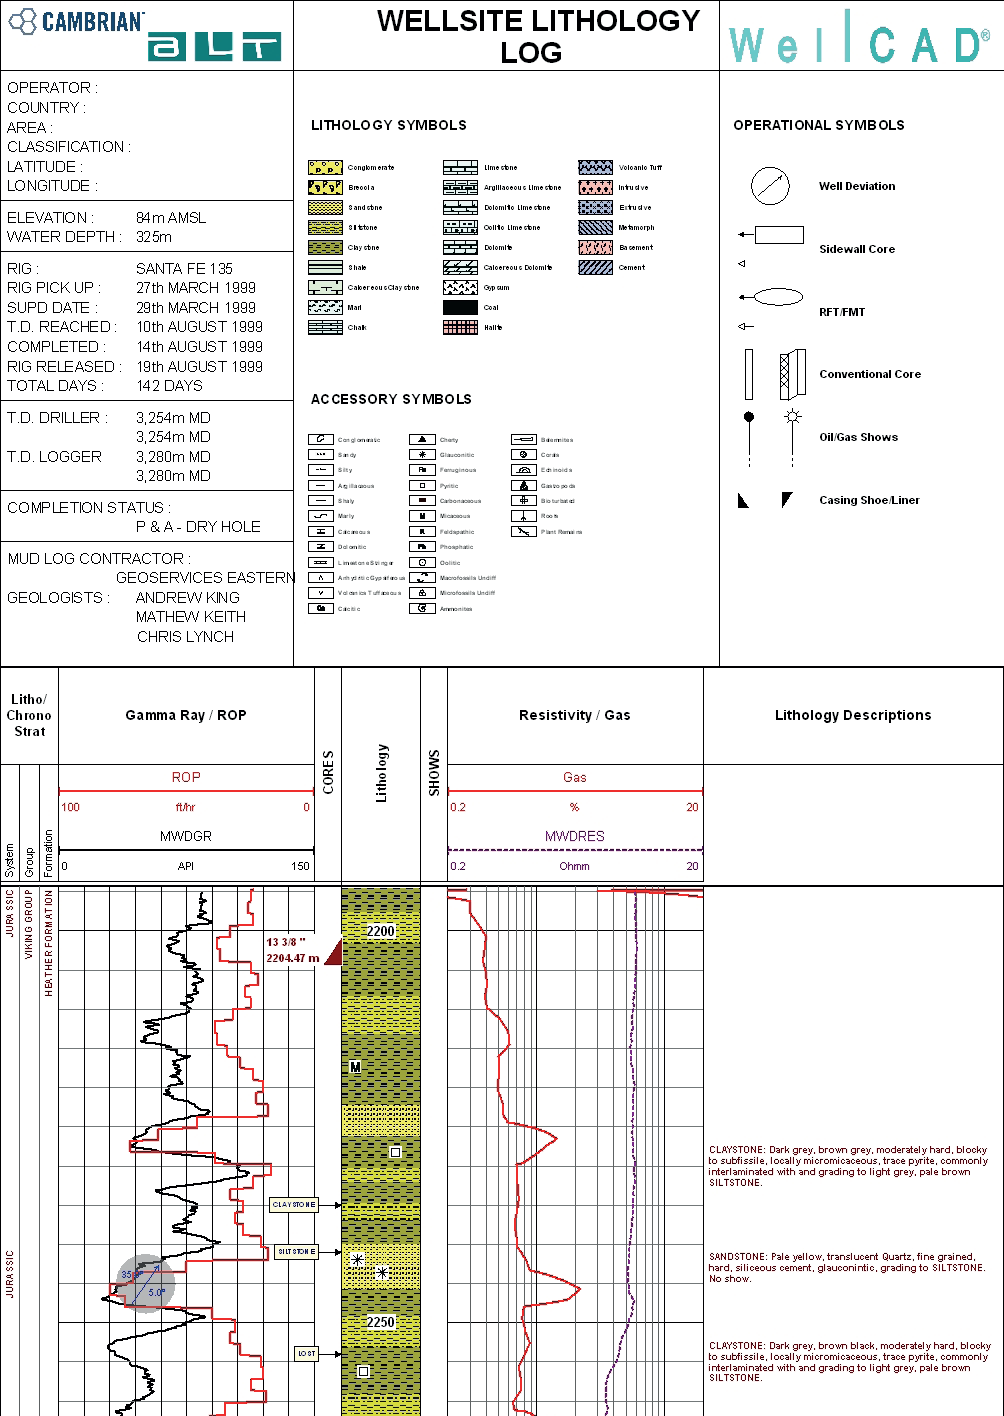
- Display of curves, patterns, symbols, text, formation markers, image data, photographs,…
- Comprehensive sets of formatting styles (point, bar, curve style, color, thickness, fonts, shading,…)
- Editor for custom symbols, patterns, header & trailer design
- 3D Borehole Display
- Common Data Processing Tools : resampling, filtering, single-, block- or multi curve statistics, equation editor,…
- Specialized Workspaces for Image & Structure Interpretation, FWS data, core description, multi-well correlation,…
- Cased Hole Interpretation Workspace (available in 2016)
- Cross plotting workspace and chart log
- Application Programming Interface for batch processing scripts or advanced algorithm development
Intuitive Data Management
- Choose from 28 different data container types to host single point, interval or array data
- New intuitive user interface to manage data and properties
- Powerful templates for automatic plot formatting
- Alias tables for mnemonic management and standardization
- Automatic audit trail of changes made to each data container
Mobility
- WellCAD works on PCs, laptops and tablets with Windows OS (32 and 64bit compatible, supported by Windows XP, Vista, 7, 8, 8.1 and 10)
- Completely portable through hardlock protection or server license borrowing
- Does not require a connection to a database system
Global Support Team
- Rely on effective support from the WellCAD team and partners in offices worldwide
- Display of curves, patterns (e.g. lithology), symbols (e.g. fossils), text, formation marker, hierarchical stratigraphic columns, image data (e.g. FMI, ATV, OTV), photographs, operational symbols (e.g. DSTs, RFTs, Mud Data, Survey Data, etc.), …
- An unlimited number of data containers, of which 28 different types exist to host single point (continuous and discontinuous), interval or array data, can be freely positioned on the workspace and combined for complex WYSIWYG plot formatting.
- Audit trail for each data container and processing step (i.e. Log History).
- No restriction to number of tracks or number of curves to be plotted or superimposed.
- Comprehensive sets of formatting styles are available for each data container type – pen type, pen thickness, pen color, fonts, shading, curve style (e.g. point-to-point, step or bar) and many more.
- Scale and appearance of vertical grids can be customized using individual classification schemes (e.g. Wenthworth scale, Phi scale).
- Depth may be referenced to MD, TVD, TVDSS or any other depth (or date & time) system due to capabilities of non linear depth matching. Support of depth and elevation display.
- Libraries of customizable and scaleable patterns and symbols (e.g. lithology, physical structure, fossils, pore types, …) are provided. The freely distributed LithCAD application allows design and import of new patterns and symbols.
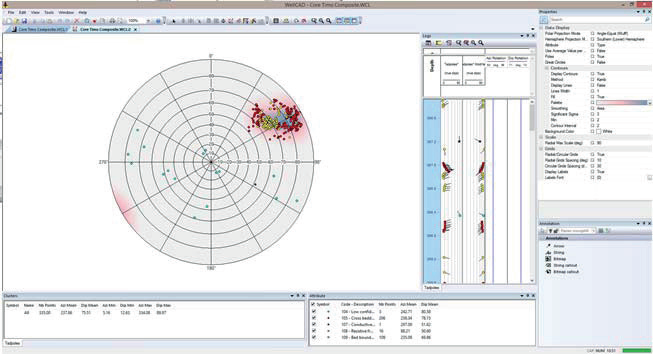
Dips Workspace (Polar/Rose/Stereonet)
Data Management
- Data Formats – Import (LIS, DLIS, LAS, ASCII, EXCEL, WITSML, JPEG, AGS,…)
- Data Formats – Export (LIS, DLIS, LAS, ASCII, CGM, JPEG, EXCEL, Petrel compatible ASCII,…)
Depth Management
Multiple Depth Management
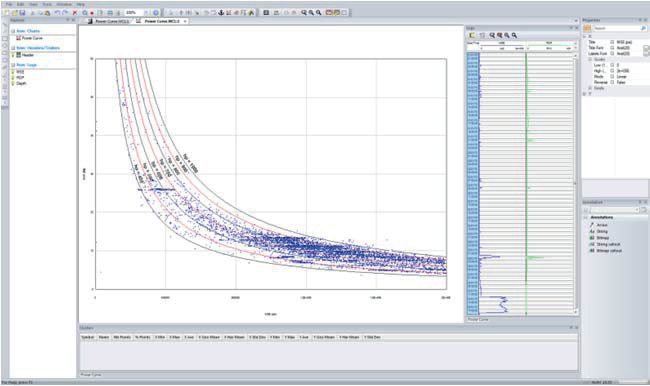
Cross Plot Workspace
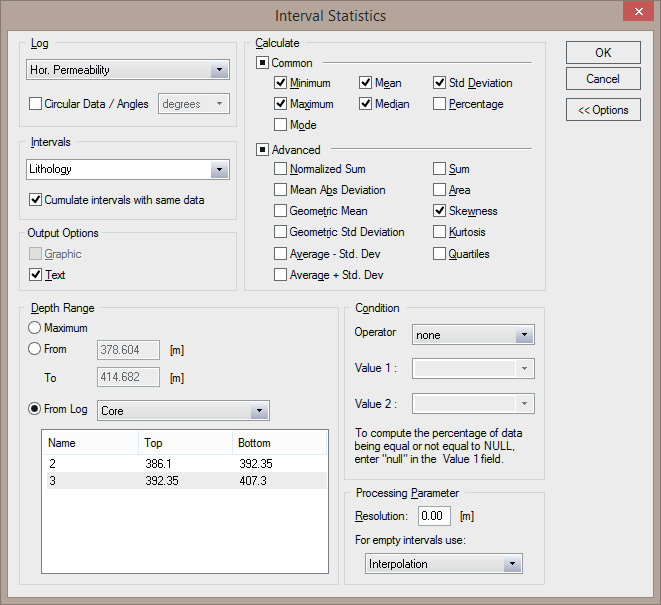
Interval Statistics
Data Interpretation
- Cross plotting workspace (up to 4 components, clustering, overlay and regression options).
- Chart Log for cross plots, ternary diagrams and histograms as part of the report.
- Workspace for dip data (rose, polar projection, walkout and woodcock diagrams).
- Tracking and statistic bars for interactive determination of statistical information.
- Interval and multi-log statistics.
- Interactive input and editing of data (in spreadsheet editor and graphic layout).
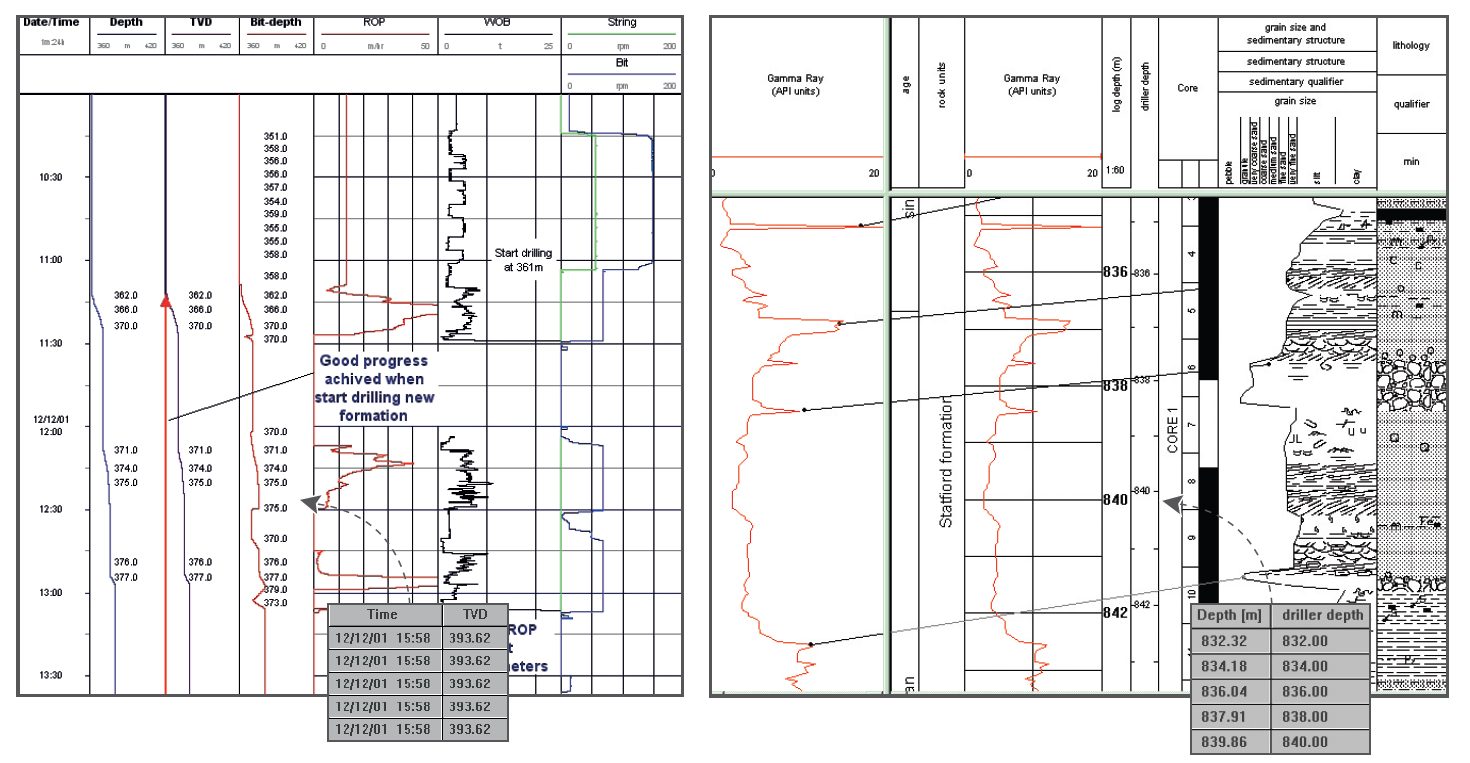
- Sophisticated annotation options including operational symbols for wellsite geologists.
- Filter, resampling and data interpolation options.
- Custom equation editor
- Zonation
- Computation of borehole deviation data (azimuth, tilt, northing, easting, TVD and more).
- Borehole condition corrections.
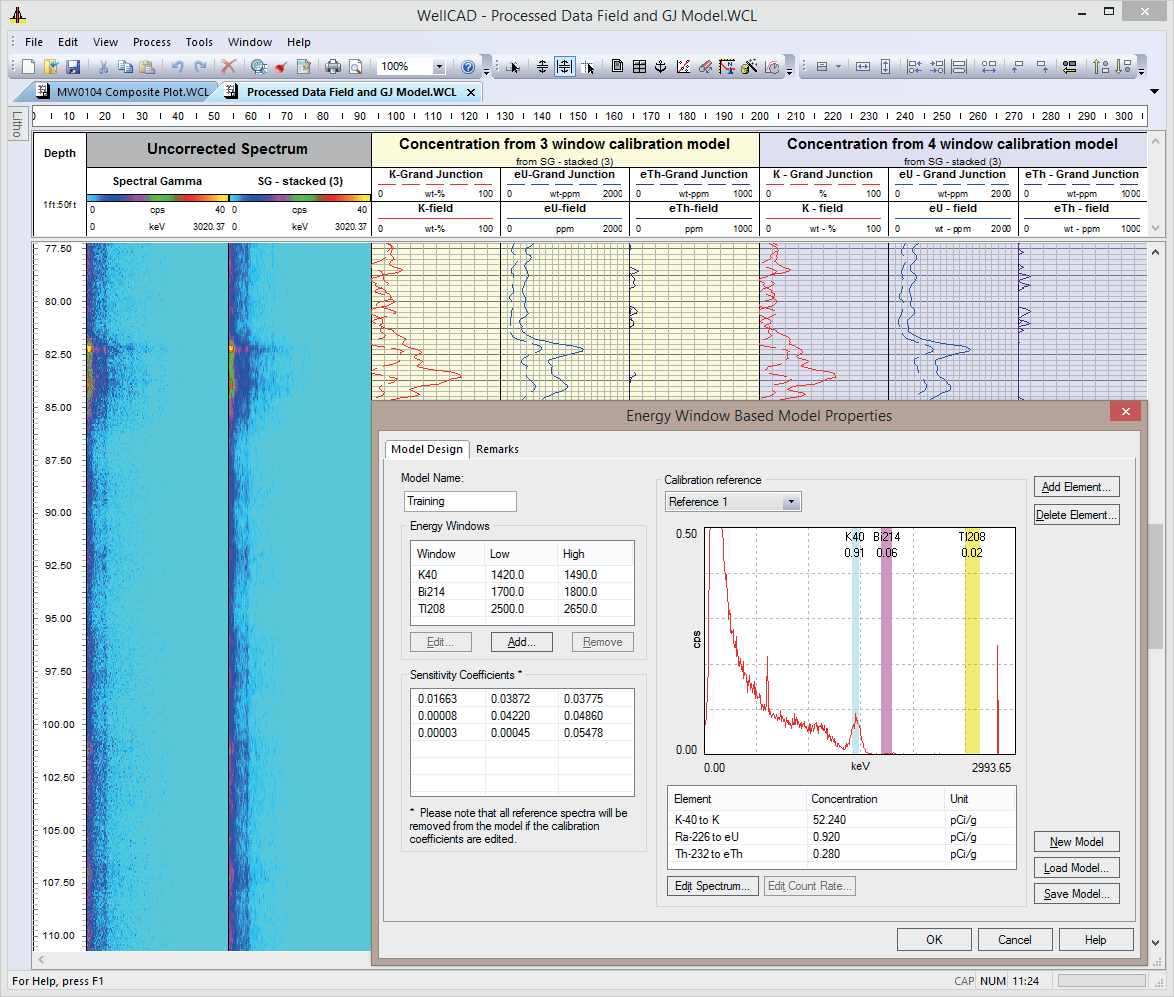
- Total & spectral gamma processing (window stripping and full spectrum analysis).
- Borehole volume calculations.
- Multi log statistics.
Annotations and Operational Symbols