OPAL Data Acquisition System

The OPAL acquisition system is based on a modern electronics design in which software control techniques have been used to the best advantage
The hardware incorporates the latest electronic components with embedded systems controlled via the specially developed LoggerSuite windows interface program. The system design philosophy is unique in two respects, firstly it is totally software controlled, and secondly it has been built to accommodate multi-vendor tool types. As standard the OPAL operates all tools using the ALT/MSI QuickLink (QL) protocol, and the PROBE PTX-Intellex and KUSTER telemetry communication protocols. It is also the preferred system to run the Borehole Magnetic Resonance (QL40-BMR60) developed by Qteq. 
Key Benefits
- “Scientific Data Systems Inc – Warrior” connectors-wiring compatibility.
- Multi tool family capability by the means of dedicated tool specific adapter modules.
- Rugged rack mount chassis construction, heavy duty, and fault tolerant electronics.
- USB interface, runs on any PC compatible notebook.
- Windows operating system platform.
- Wireline and winch flexibility – runs on coax, mono – or multi-conductor wireline.
- High speed uphole telemetry system and automatic telemetry tuning.
- Improved telemetry performance on long single and multiconductor wirelines when used in conjunction with the latest generation of ALT/MSI tools. New Equalizer and Train processes.
- Totally software controlled using Logger Suite software.
- Real-time data display and printing.
- Very easy to use, with graphical user interface, self-diagnostic features, configurable through files, minimal user input required.
- Real-time logging in WellCAD Software.
- Shaft encoder flexibility – compatible with any 12V or 5V AB shaft encoder, and configurable for any combination of wheel-shaft PPR.
- Wireline tension monitoring. Tension adapter compatible with any tension sensors-gauges.
- Up to 8 analog inputs to collect information from external sensors.
- Modular design for ease of maintenance.
Technical Specifications
Dimension (W x L x H): 52 x 50 x 21 cm (20.5 x 19.7 x 8.3 in.) Weight: 21.5 kg (46.3 lbs) Input Voltage: 100-240 VAC, 50-60 Hz inverter compatible Tool Power: Up to 400V / 1.3A – (750W) PC Connection: High Speed USB Logging Cable: Standard single, multi-conductor and coaxial Tools / Telemetry: ALT Standalone Tools, ALT/MSI, QL Probe line, KUSTER tools, PROBE1 tools, other third party tools on demand Upgradeability: User upgradeable firmware Software: LoggerSuite Version 12.1 or later 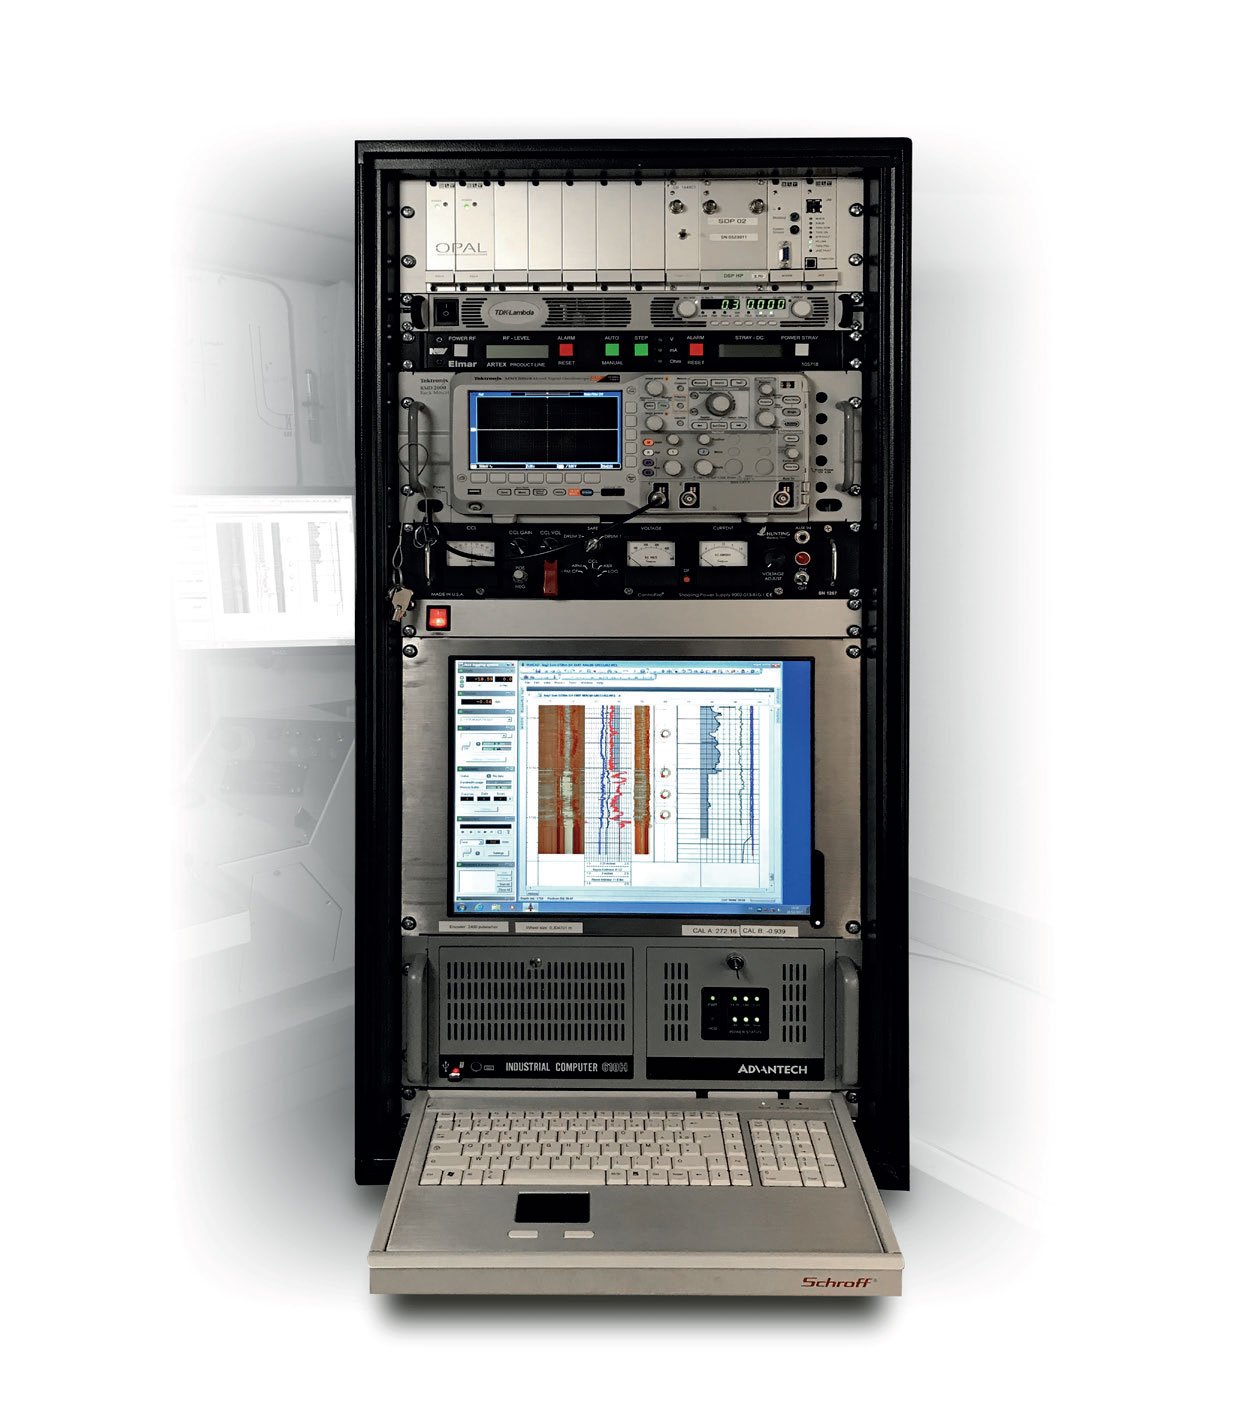
LoggerSuite Software
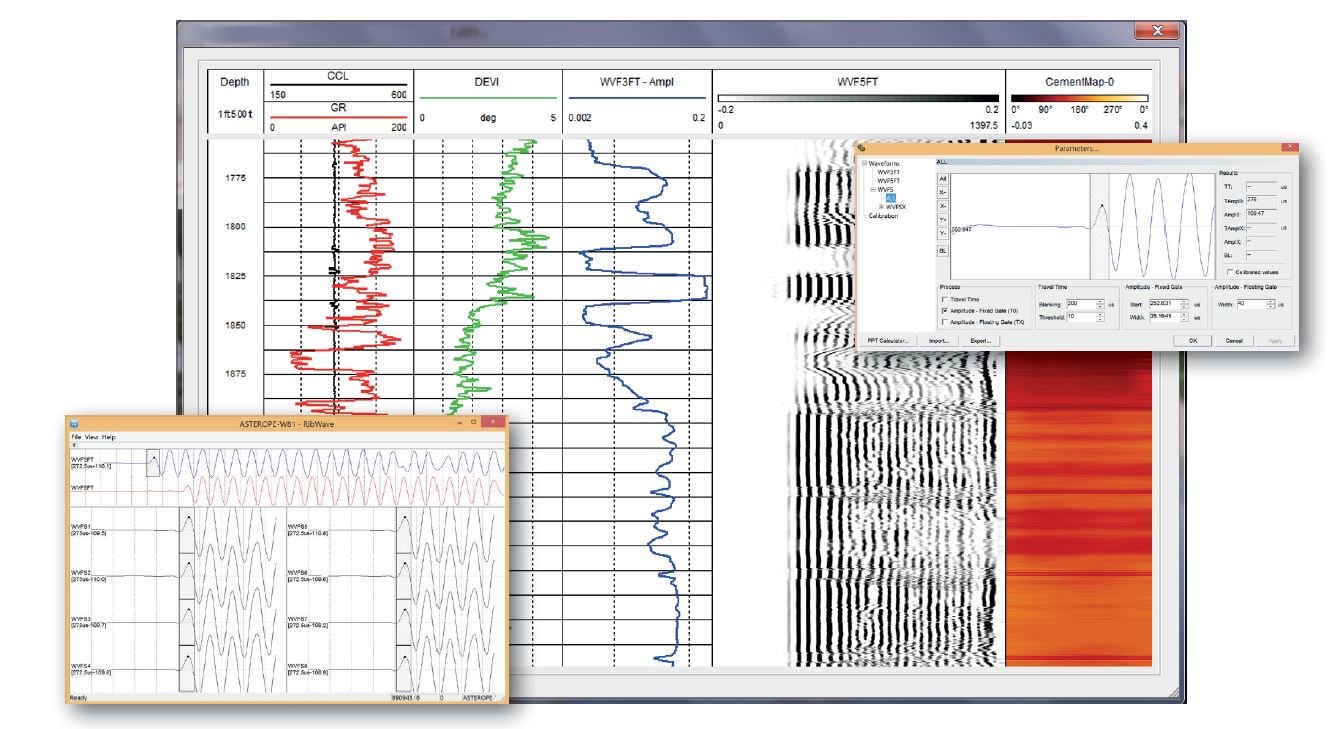
LoggerSuite software is compatible with all ALT/MSI data loggers. The software is easy to use and the interface conforms to the Microsoft Windows standard. The heart of the graphical user interface is the dashboard. The operator uses the control panel to select and control all system functions, monitor the data acquisition process and observe the logging tool status. The dashboard consists of multiple threads running concurrently and handling specific system tasks simultaneously. The dashboard provides access to the following windows :  Browser windows are used for real time data monitoring and offer a wide choice of display and printing options for conventional curves, full waveform sonic traces, acoustic and optical borehole images. A Header Editor is available to provide sophisticated log headers with graphics. Special processors can be activated and configured for real time processing.
WellCAD Browser
WellCAD Browser add-on module allows a real-time connection between the WellCAD data processing platform and the OPAL logger. – Collect data directly in WellCAD
- Apply templates
- Allow real time editing (annotation)
- Compare currently logged data with reference / repeat data
- QA / QC tasks
- 3D display
- Data preprocessing and field interpretation
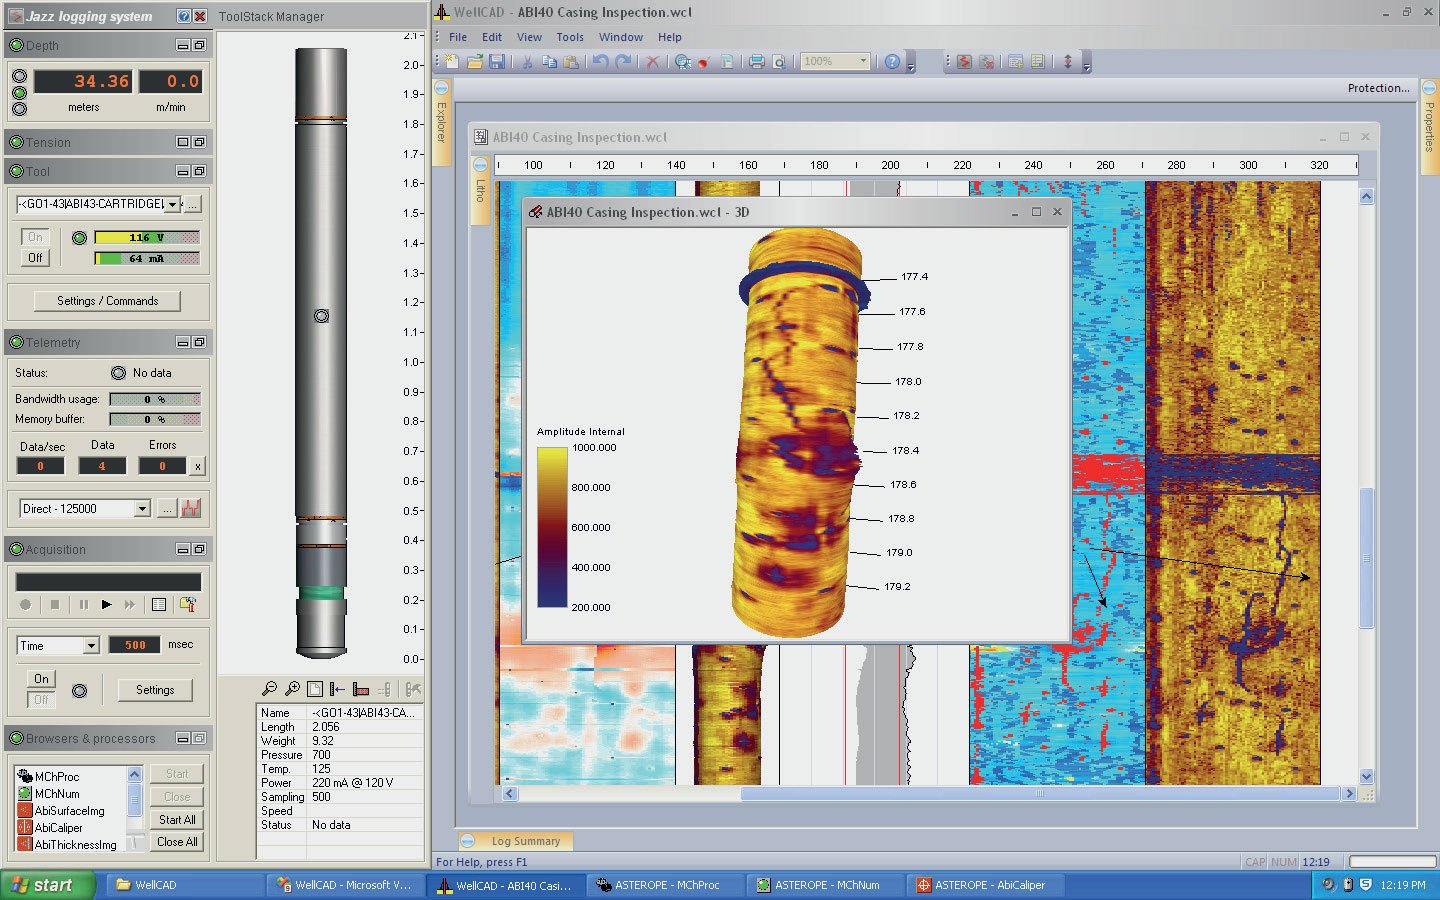 In this example, the operator is able to monitor the real time scrolling log, view any or all other logs while monitoring all the log outputs, including depth. Optionally, raw sensor data may be displayed. Comparison with main and repeat sections is possible as well as scrolling and adding annotations while data acquisition continues. Log curve scale and other presentation parameters may be adjusted while logging.